The UC Sierra Foothill Research and Extension Center has nearly 40 years of rangeland forage production and environmental data. This information is widely used for assessing how current-year forage production compares to previous years and for forecasting potential trajectories of peak forage production for the current growing season. While these comparisons are valuable, until now visualization of this data was fairly cumbersome. SFREC has addressed this need by developing an interactive web application, which allows rapid and flexible visualization of all current and historic data.
Users of the web application are now able to examine current and historical rangeland production for any year between 1979 and the current year. The application should prove to be a useful resource for ranchers, extension specialists, landowners, rangeland managers, and curious individuals alike.
Users of the application will choose what dataset they would like to look at, and then they will select the time period in which they are interested. If soil temperature or precipitation are selected, the user will be able to select from a range of years.
With that background information in mind, let's get our hands on the application and take a look!
Click HERE to open up the web application.
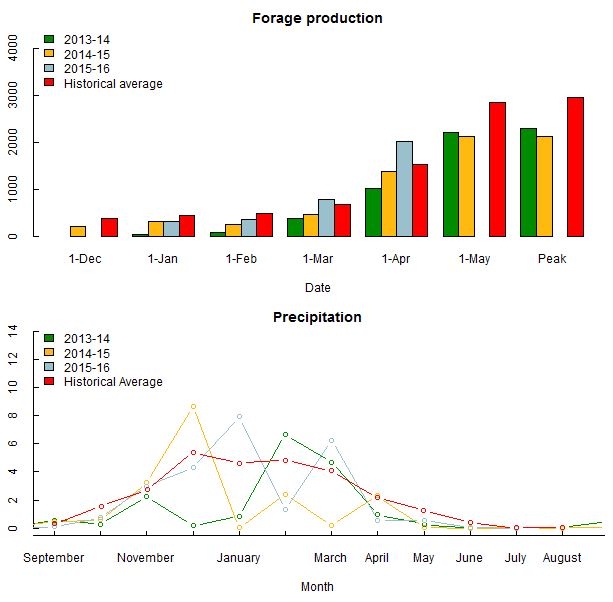
Upon opening up the application, forage production and precipitation will be displayed for the current growth year (September – August). The application will display the following graphs shown at the bottom of this page.
Examining the data may lead to some interesting conclusions. On the lower graph, we can see that early season precipitation was below average until a wet January. 2015-16 had a drier than average February and a fairly wet March. Moving up to the production plot, we see that early season production was also below average, until a large amount of growth occurred between February 1st and March 1st. Production was well above average for the rest of the year, with nearly 1000 pounds per acre higher peak production than in an average year.
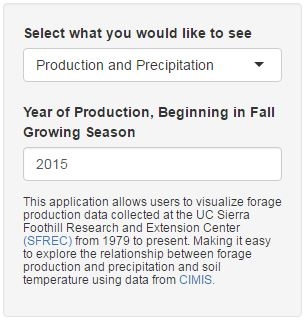
We can change the year that we are looking at by scrolling over the year on the left hand panel, and clicking up or down on the arrow as shown on the interface below.
Additionally, a user can type in the year they are interested in. Let's take a look at the 2007 growing season. Looking at the precipitation graph, 2007-08 was a dry year, in comparison to the historical average. From the same graph, 2005-06 was much wetter than average. Forage production in 2007-08 was nearly 1000 pounds per acre less than the average, while 2005-06 was nearly 1000 pounds heavier.
Soil temperature – an important measurement for germination and production – is also included in the application. If you select a range of a single year on the application, the historical average will also be displayed on the same graph.
The application will be updated frequently to provide users with valuable, up-to-date information. Environmental data will be updated once per month based on CIMIS outputs. Production data will be updated during the growing season as soon as field measurements are taken.
Feel free to explore the application and let us know what you think by leaving a comment below. We suggest bookmarking the application url if you would like to check in regularly. If you know someone who might be interested in looking at the data provided, share this blog post with them, or send them the link to the application.
This application was developed by Jack Cronin, a student employee working with SFREC this summer. Jack is currently studying Environmental Engineering at U.C. Merced, with a background and future interest in the rangeland profession.

